User Flows
"Genius is the ability to reduce the complicated to the simple."
— C.W. Ceram
A user flow is a visual representation, either written out or made digitally, of the many avenues that can be taken when using an app or website. They are used to communicate the intended flow of a user through various pages and actions in an app or website.

- They do not illustrate the underlying technology
- They do not illustrate the development methodology
- They do not illustrate the developer steps
- They illustrate the steps taken by the user
Flow charts
The flowchart begins with the consumer's entry point on the product, like an onboarding screen or homepage, and ends with the final action or outcome, like purchasing a product or signing up for an account.
A node in the flow chart represents each touchpoint on the user's journey. These nodes are characterized by shape, and each shape indicates a particular process.
Flowchart of user sharing an article online
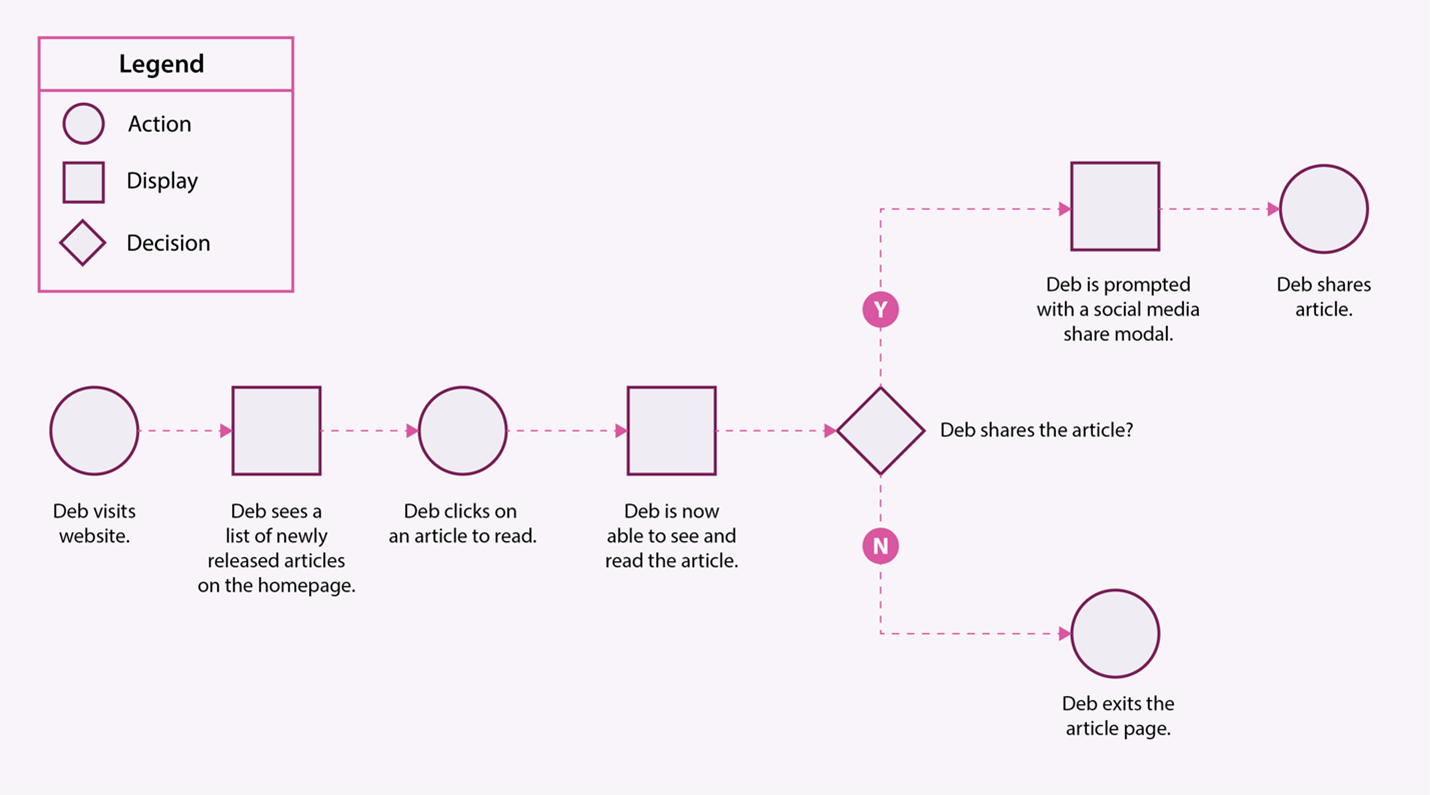
Adobe. Image Credit Dan Silveira.
Flowchart of adding item to Cart

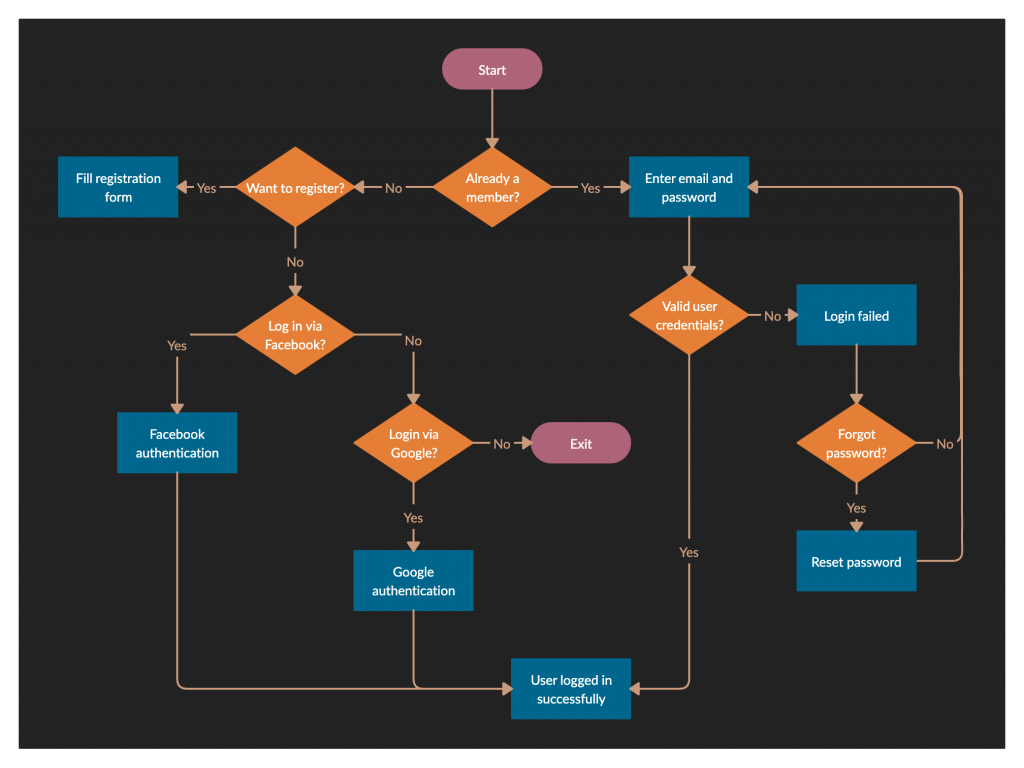
Flowchart for user registration
Flowchart Symbols for UX Design
| Shape | Representation |
|---|---|
| Oval | Start & End |
| Circle | User Action |
| Rectangle | Screen or Display (ouput) |
| Diamond | User Decision |
| Parallelogram | User Input |
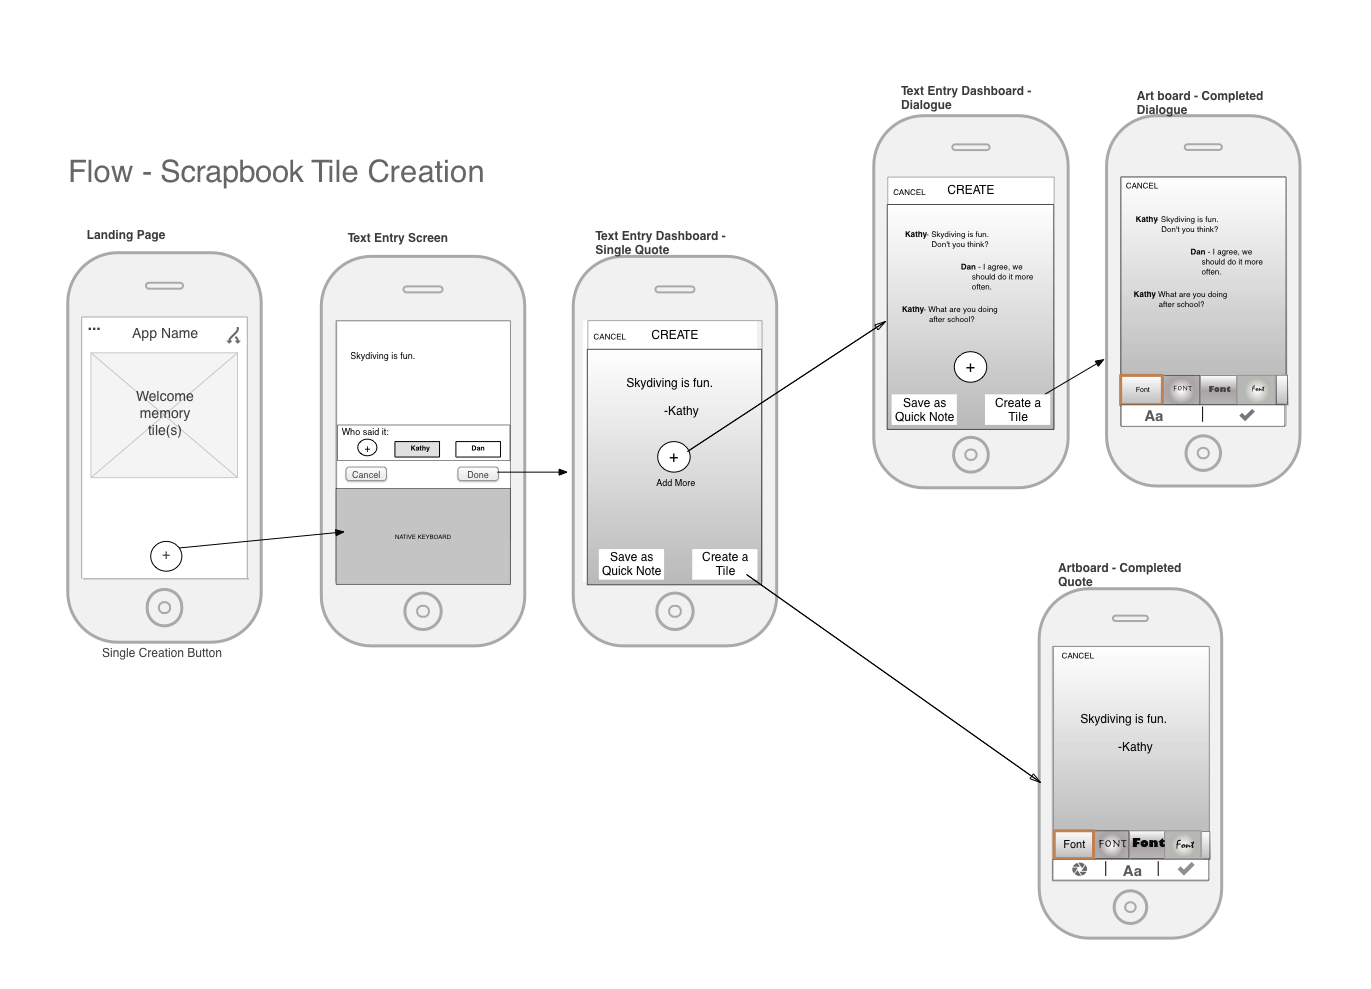
Wire flows
A wireflow is delivered in a wireframe-style layout. It depicts the user flow and interaction by illustrating the actual product instead of using shapes and symbols. Wireflows emerged as a common practice among teams designing mobile apps, where each step in the flowchart is represented by a wireframe for a full mobile-screen design. Because of the relatively small size of mobile screens, actual page designs (i.e., wireframes) could easily replace abstract symbols in flowcharts.
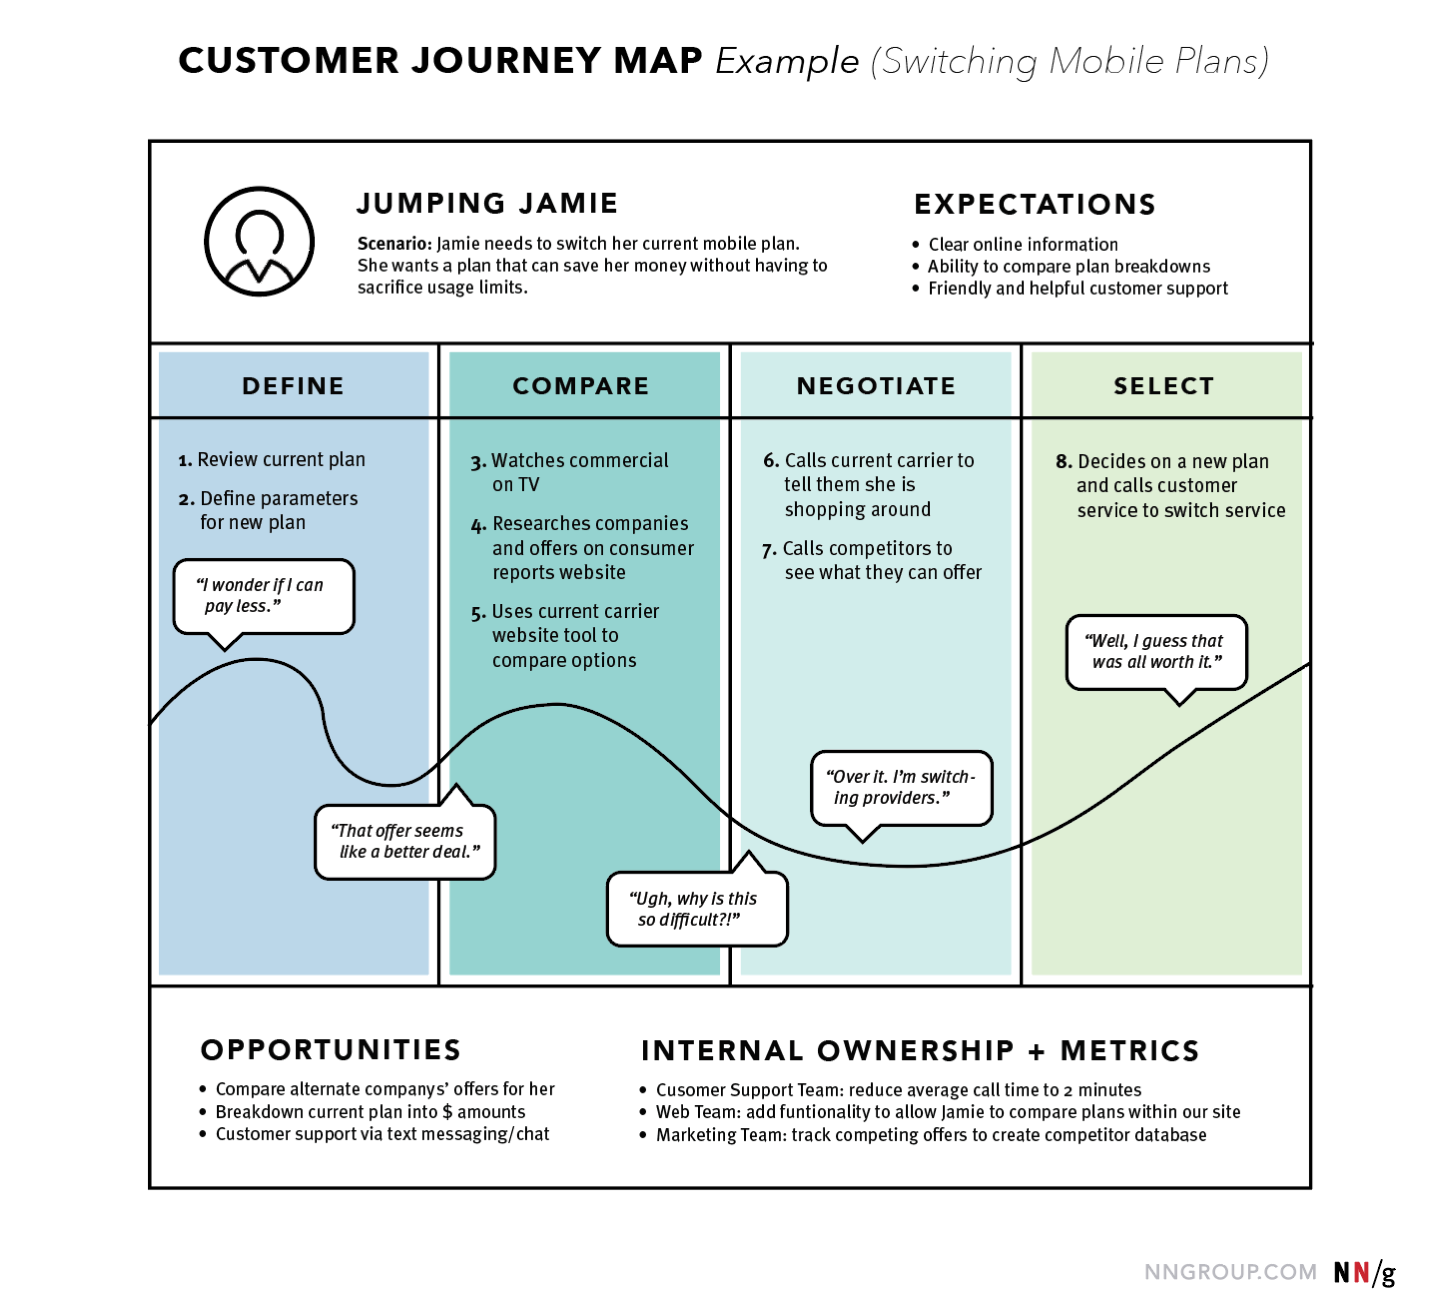
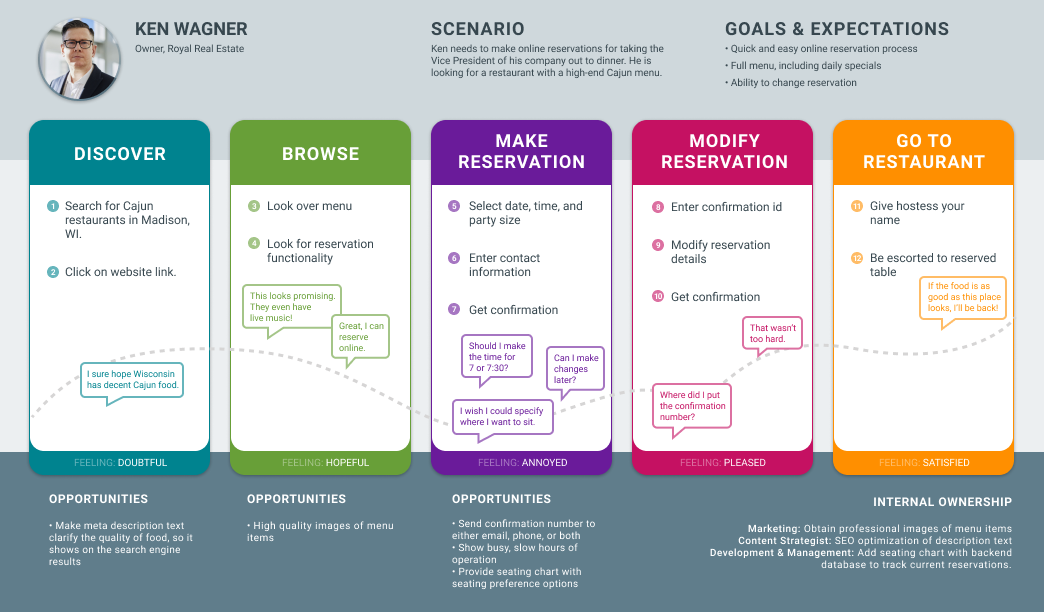
Journey Map
A journey map is a visualization of the process that a person goes through in order to accomplish a goal. In its most basic form, journey mapping starts by compiling a series of user actions into a timeline. Next, the timeline is fleshed out with user thoughts and emotions in order to create a narrative. This narrative is condensed and polished, ultimately leading to a visualization.